"Constant Relative Humidity" Maintained by RDC < rdctheory.cloud
Since water vapor is a greenhouse gas, increase in water vapor amount in the atmosphere contributes to enhance the greenhouse effect and hence warming, while decrease contributes to reduce the warming. We claim on this website and in our promotional tweets that "RDC maintains a constant Relative Humidity (RH) in the troposphere". Here we explain exactly what our claim is based on.
[NOTE]
The word "water vapor amount" refers to ABSOLUTE humidity.
It should be distinguished from RELATIVE humidity,
which is its ratio relative to the saturated water vapor amount.
The saturated water vapor amount can be obtained from pressure and temperature.
The saturated amount quickly increases with temperature increase.
These two humidities can be calculated from each other given a specific condition.
First, three aspects of “constant relative humidity” and their reasons are introduced.
Then we explain what results from the constant relative humidity.
[NOTE]
In the explanation,
we will use the results obtained from the models in our previous studies;
DCM (Dynamical Convection Model) is
a simplified vertical two-dimensional atmospheric radiation-convection model.
KCM (Kinematic Circulation Model) is
an atmospheric model corresponding to the DCM,
but includes only the RDC mechanism and has no horizontal transports due to dynamics.
Results from the traditional CAM (Convective Adjustment Model) are
also used for comparison.
Each model was run under three different warming conditions:
STD (standard),
ENH (enhanced warming),
and XTR (extra-enhanced warming).
Refer to
the original papers
for details.
The figures shown here are taken from our previous studies. The figures show the results obtained from the DCM (a vertical 2D model that explicitly treats both radiation and convection processes) and the KCM (which only incorporates the RDC mechanism extracted from the DCM). Therefore, the differences between these two figures can be attributed to the presence or absence of dynamical transport.
First, the two corresponding figures are remarkably similar, except for the Convective Boundary Layer (CBL) at the lower edge of the atmosphere in the DCM. This surprising result shows that net transport is dominated by RDC, and indicates that the intuitively expected dynamical transport can be safely ignored.
Due to low temperatures, relative humidity inevitably becomes high near the tropopause (z〜9km). If water vapor were transported by a chimney-like circulation, the relative humidity contours within the troposphere would align horizontally, because temperatures are higher in the lower layers. However, we observe that these contours stand vertically in the middle troposphere. This indicates that relative humidity tends to remain constant vertically.
In subsidence flows of RDC, moist air is continuously supplied through the cumulus flank AT EVERY ALTITUDE, maintaining the vertical constancy of relative humidity.
Fig. 2 shows the distributions of the horizontal water vapor flux both reconstructed through RDC and observed within the model. These show very good agreement. This suggests that RDC is responsible for the net horizontal transport of water vapor. The most characteristic feature is that detrainment flow occurs at all altitudes. This is something DD researchers have long sought and struggled to obtain, yet could not achieve. With RDC, it is obtained as a natural result. The supply of water vapor in each layer can continuously moisten the descending air, maintaining its relative humidity vertically constant.
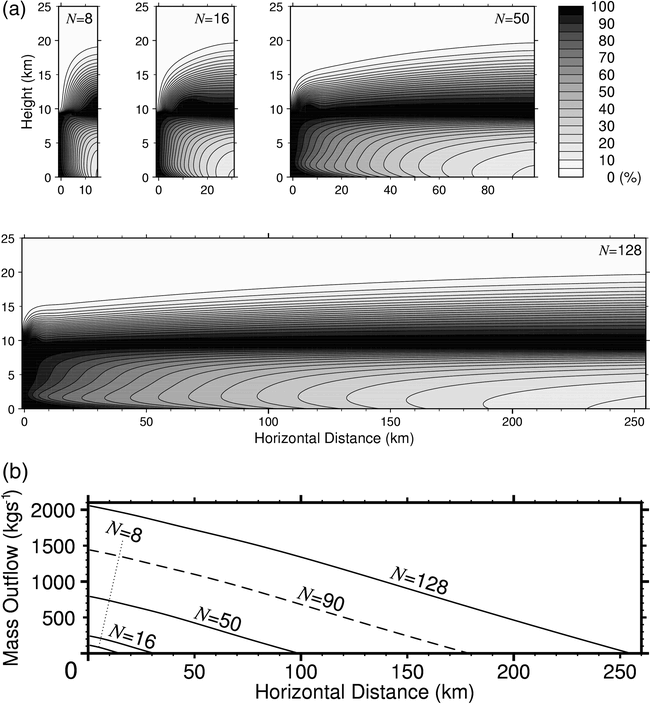
RDC creates a natural distribution in which the relative humidity is high near the cumulus clouds and decreases with distance. However, changing the horizontal distance between cumulus clouds yields a strictly geometrically similar distribution of relative humidity, as shown in Fig. RH-2(a). This indicates that the relative humidity distribution possesses an identical vertical profile when averaged horizontally, regardless of the inter-cloud distance.
This is understandable because the RDC process, in which the radiative-convective equilibrium atmosphere self-organizes its structure, including the water vapor field, is solved as a boundary value problem, unlike the dynamical transport, which is solved as a time-dependent problem. Indeed, it has been shown that the horizontal mass flux outflowing from a cumulus cloud due to RDC is proportional to the inter-cloud distance, as shown in Fig. RH-2(b).
This most intriguing phenomenon is most effectively demonstrated by plotting the vertical profile of the horizontal mean relative humidity against optical depth for different warming scenarios. In Fig. RH-3, the axis for optical depth τ is shown vertically downward, with the top of the atmosphere set as τ=0.
As mentioned above, relative humidity takes large values near the tropopause (around optical depth τ ~ 0.3). In the DCM, a CBL forms at the lower edge of the atmosphere, so large values are also observed near its upper edge (τ ~ 1.6, 1.8, 2.7 for STD, ENH, and XTR senarios, respectively). In KCM, which does not handle convective processes, the CBL does not form; therefore, the profile near the lower edge of the atmosphere has no significant physical meaning.
The most important part is the vertical region between the two peaks in the DCM. Regardless of the warming scenario, relative humidity is observed to reach its minimum value of around 35–40% between the tropopause and the top of the CBL. Even when warming progresses as in the ENH or XTR scenarios and the optical depth of the CBL top increases, this region of the constant minimum relative humidity appears just to expand vertically. Interestingly, the minimum relative humidity altitude occurs near τ~1. If the atmosphere is too thin, radiation passes straight through. Conversely, if the atmosphere is too thick, radiation cannot pass through. Thus, the layers in which the optical depth is near 1 are where the atmosphere interacts most strongly with radiation.
The exact same trend is also seen in the KCM profiles.
[NOTE]
When the atmosphere becomes thicker in the KCM,
the simplified gray-atmosphere assumption causes
radiative cooling to concentrate at a specific altitude,
weakening radiative cooling in the lower layers.
Especially for the XTR scenario,
this resulted in unnatural RDC inflow toward cumulus clouds in the lower troposphere,
leading to a significant decrease in relative humidity.
Using a more sophisticated radiative calculation scheme
should achieve a more vertically uniform radiative cooling rate,
yielding trends similar to those in DCM.
(But in that case, the definition of atmospheric optical depth would not easy,
and simple discussion like ours developed here would be difficult.)
Thinking of the case of Dynamical Detrainment, an air parcel sinking from the upper troposphere continues to raise its temperature without a supply of water vapor from the surrounding area. Therefore, the relative humidity continues to decrease all the way to the top of the CBL. Its minimum value must be realized just above the CBL; there should not be a layer of constant minimum relative humidity in the middle of the troposphere.
Thus, when examining the structure of the atmosphere through optical depth, it should be surprising that the structure above the CBL exhibits IDENTICAL characteristics across different warming scenarios, even if you are not an ardent supporter of DD. This finding suggests that the entire Earth's atmosphere is strongly governed by radiative processes through RDC, except for the CBL at the lower edge of the atmosphere, where convective processes are always dominant.
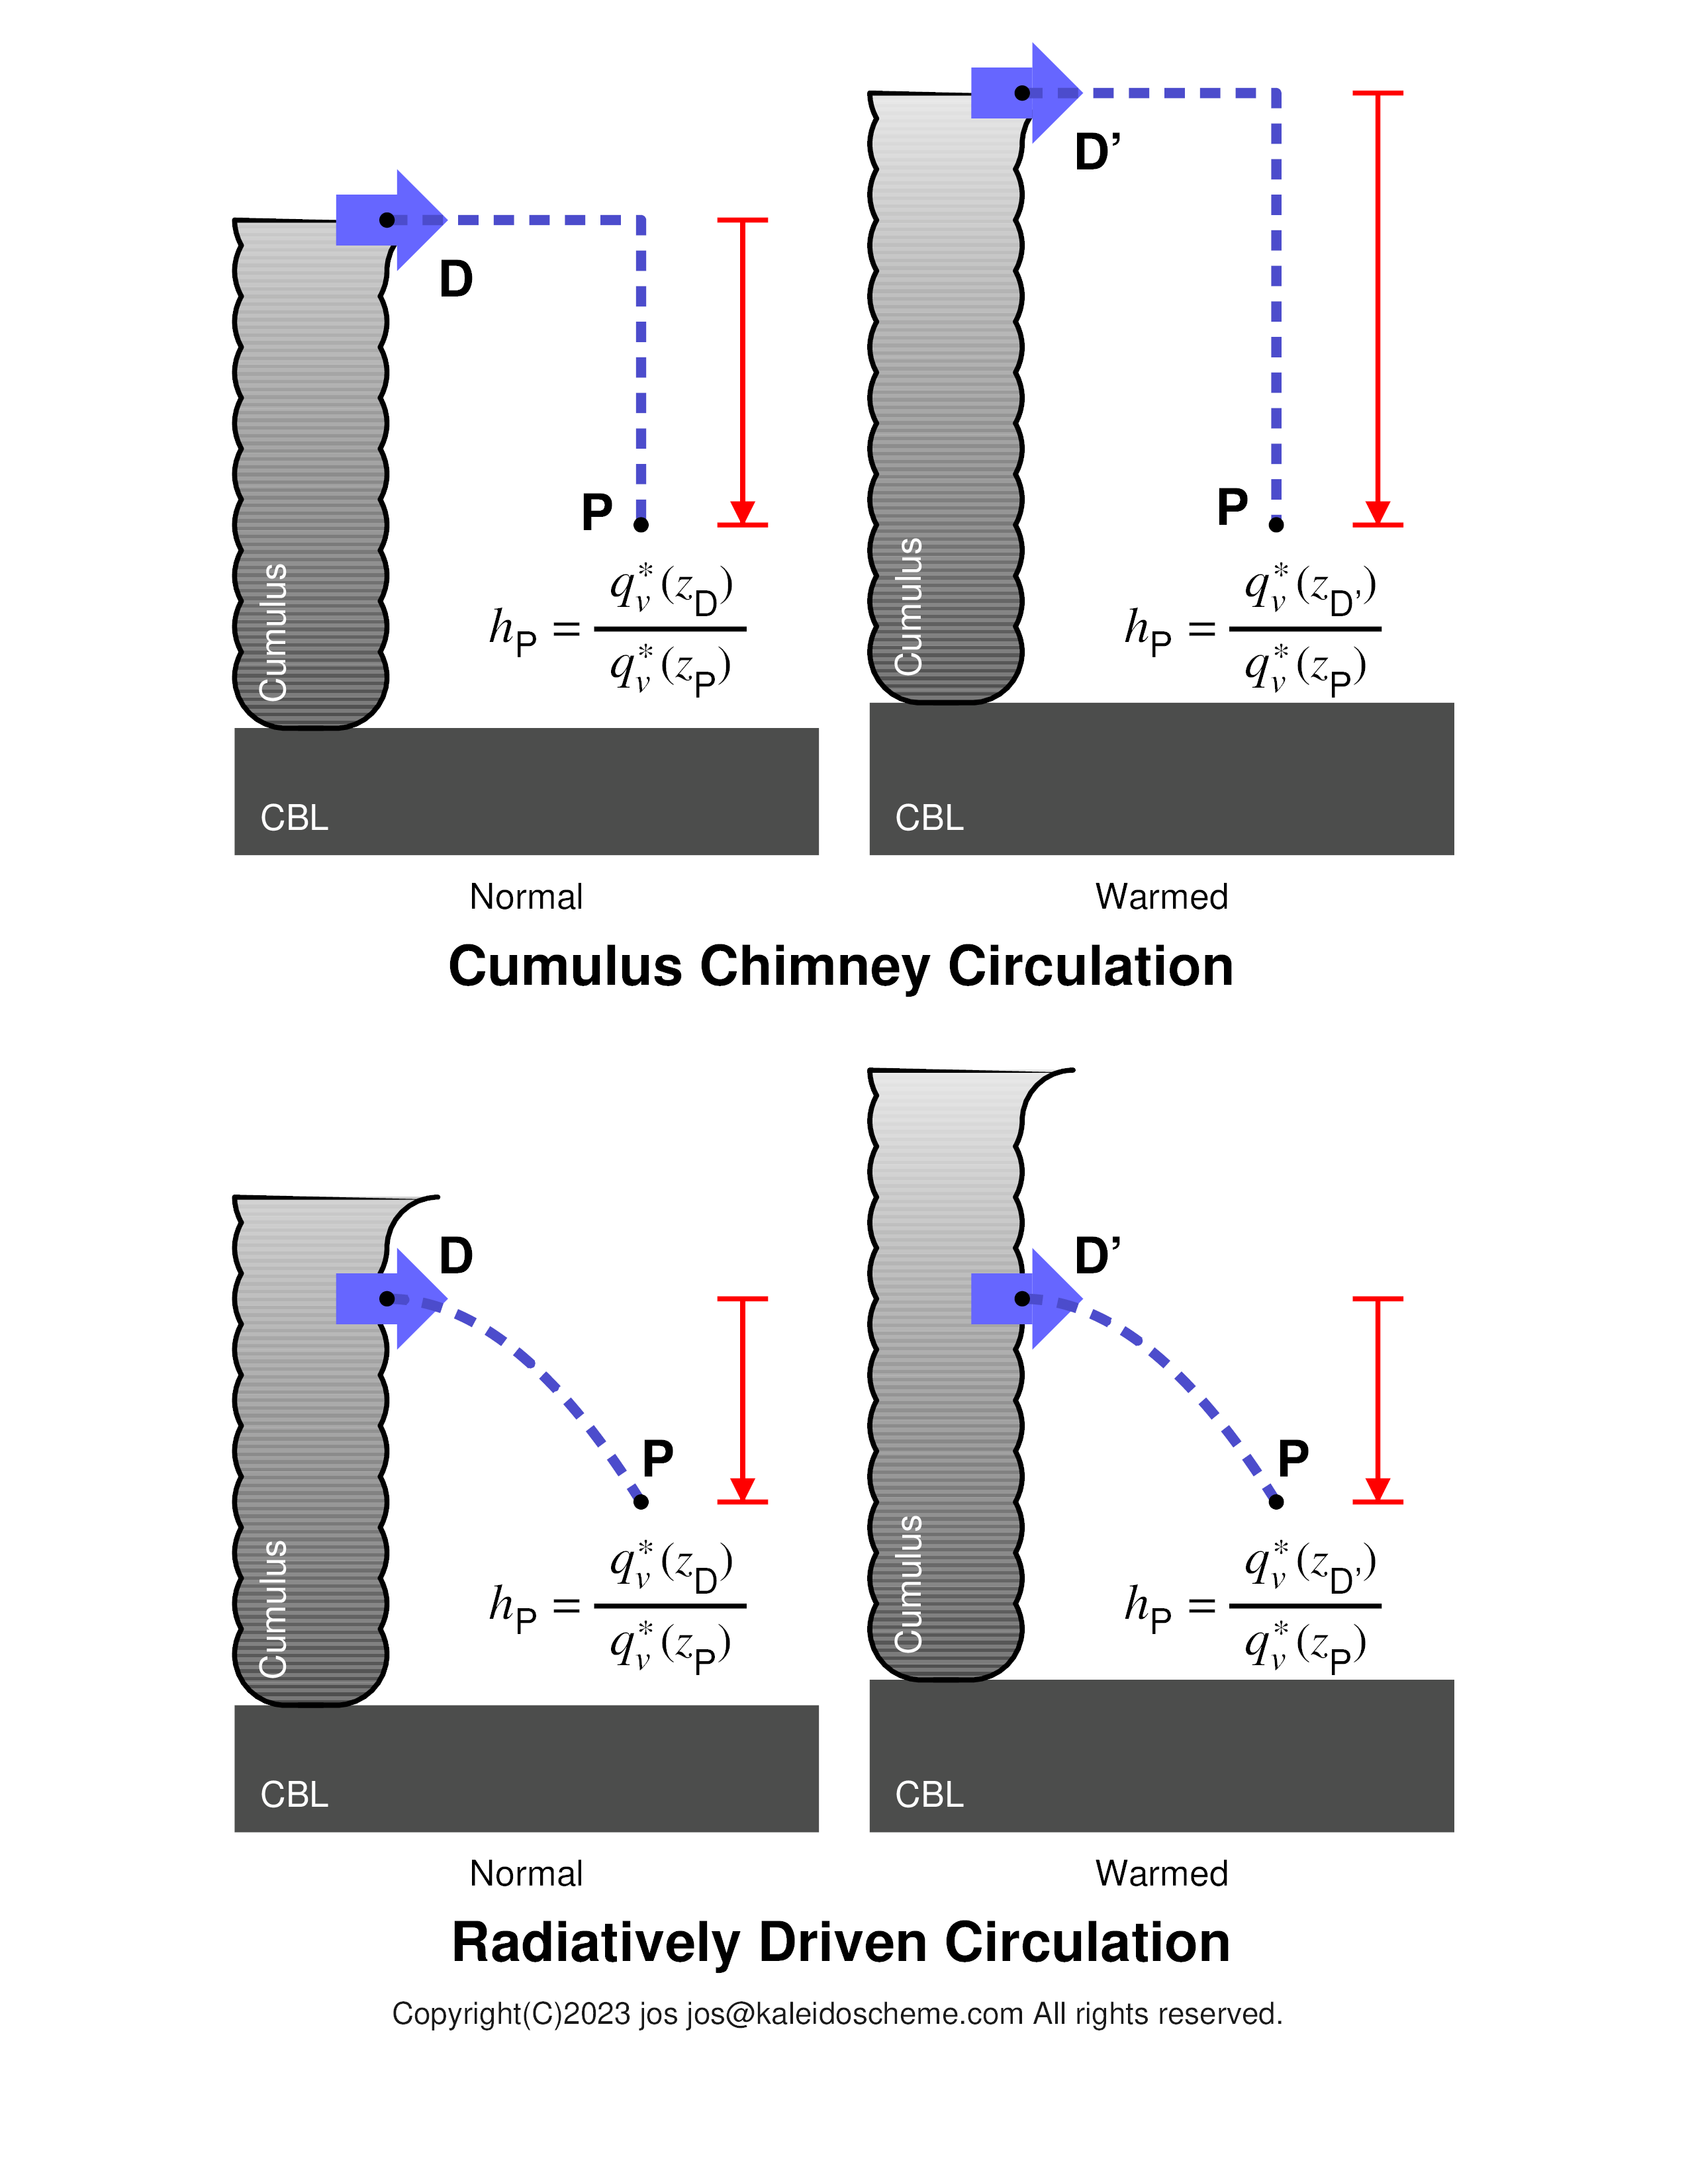
Figure RH-5 above is a modified version of Fig. 11 in Iwasa et al. 2004 . Please refer to the detailed explanation .
The above aspects of the relative humidity obtained through RDC integratingly lead to our claim that "RDC maintains a constant relative humidity in the troposphere". This perfectly explains the primary hypothesis in the Convective Adjustment method, that "relative humidity within the troposphere can be assumed to be constant", which no one has ever physically explained, used in the initial warming research that won the Nobel Prize.
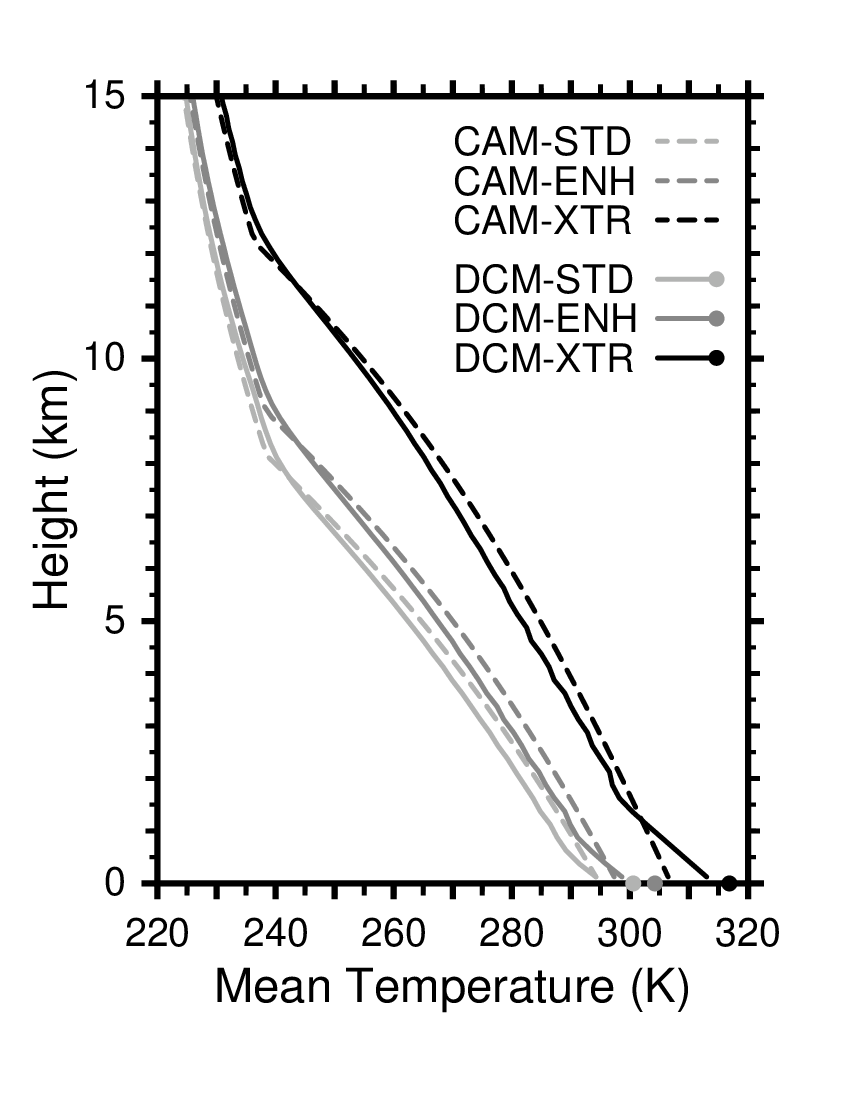
In fact, as shown in Fig. RH-6, comparing the warming trends between the Convective Adjustment Model (CAM) and the DCM yields excellent agreement, especially upper and middle troposphere.
We have shown above that, regardless of cumulus spacing or warming conditions, the region in the middle troposphere is maintained with the minimum relative humidity with a constant value. When relative humidity is constant, the amount of water vapor in the troposphere is proportional to the saturation water vapor mixing ratio rapidly increasing as temperature rises. Since water vapor is a greenhouse gas, increase in water vapor amount contributes to enhance the greenhouse effect. Therefore, the maintenance of the constant minimum relative humidity indicates that global warming caused by increases in greenhouse gases such as carbon dioxide is ACCELERATED by a STRONG POSITIVE WATER VAPOR FEEDBACK. The RDC argument completely negates the warming reduction effect built in the atmosphere, which is suggested by the discussion of Dynamical Detrainment, compelling us to worry about an extremely severe warming future.
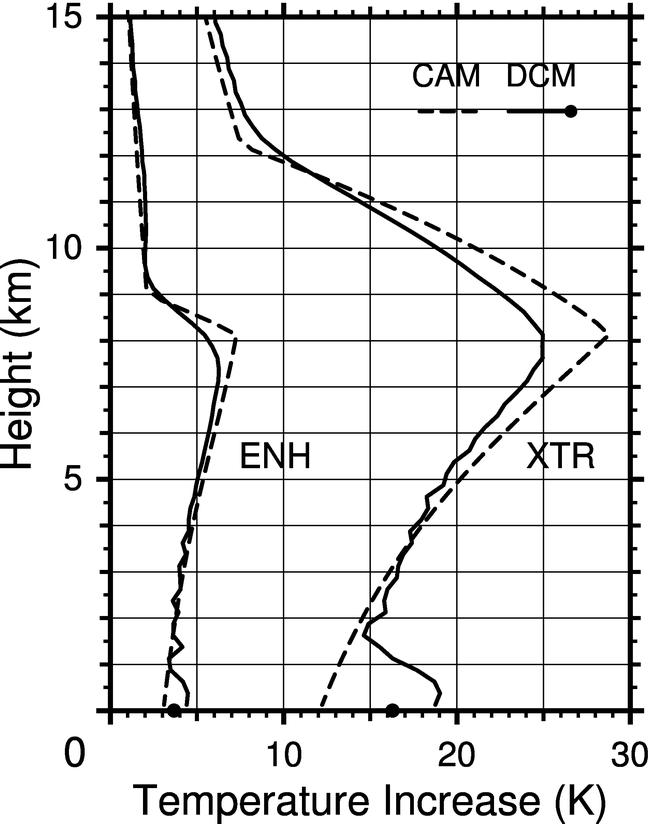
Similar to the real atmosphere, CBL formation was observed within the DCM, in spite that the DCM does not include special treatments for the CBL. Although the warming trend is fundamentally the same for both CAM and DCM, we would like to emphasize that the CBL forming at the lower edge of the atmosphere within the DCM causes differences between the two models. Since the temperature profile within the CBL takes a large value of the dry adiabatic lapse rate, the CBL, which increases in thickness with warming, causes further accelerated temperature rise at the lower edge of the atmosphere, as shown in Fig. RH-7. Since the ocean surface and ice sheets exist and we live precisely at the bottom of the atmosphere, this is an extremely serious phenomenon in the context of global warming. We have named this the " Subcloud-Layer Warming Effect." It is one of the intriguing topics that should be thoroughly examined in future warming research, together with RDC itself.
"Constant Relative Humidity" Maintained by RDC < rdctheory.cloud
First edited on 2024/12/29
First uploaded on 2025/09/26
Last uploaded on 2026/02/12
Copyright(C)2024-2025 jos <jos@kaleidoscheme.com> All rights reserved.