Two Types of Circulation in the Atmosphere < rdctheory.cloud
Two types of circulation exist in the Earth's troposphere in radiative-convective equilibrium: one is convectively-driven circulation and the other is Radiatively-Driven Circulation (RDC). These are two completely separate and independent circulations. Confusing these two circulations leads to false conclusions. Our previous numerical experiments on radiative-convective equilibrium atmospheres using DCM (Dynamical Convection Model) also yielded both circulations ( Iwasa et al. 2002). Here we will explain the difference between the two circulations by showing examples of DCM results.
The DCM (Dynamical Convection Model) is a simplified model that explicitly treats radiative transfer and dynamical flow in a vertical two-dimensional atmosphere. Within the DCM, intermittent cumulus clouds develop to resolve convective instabilities created in the atmosphere.
[NOTE]
It is unrealistic, because it is different from the real atmosphere,
for the cumulus to develop repeatedly at a fixed horizontal location in the DCM.
However, this feature is the main reason why we were able to derive the RDC mechanism.
There are three possible reasons for the fixed location of cumulus development in the DCM.
If the third condition works to fix the location of the cumulus, then it may be possible to fix the location of the cumulus using the copper-grain condition in the 3D atmosphere. If this can be done, RDC analysis in the 3D atmosphere may be as easy as in the DCM case. Someone with a 3D cumulus-resolving model could try it.
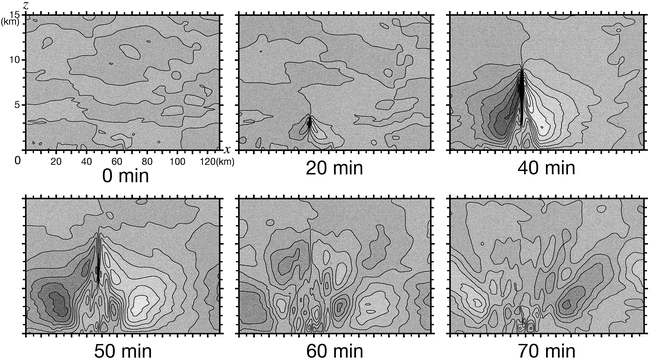
Snapshots of the resulting flow field yield the streamlines shown in Fig. TTCA-1. The streamlines show the mass flux (product of air density and velocity) field of the atmosphere at that instant, connected by lines. In the real atmosphere, the narrow updraft domain of the developing convection in the first half stages of Fig. TTCA-1 is familiar to everyone as a cumulus cloud because it is visualized by condensed cloud water. Most people imagine a flow field similar to chimney convection with outflow only near the top of the cumulus, as shown at 40 min, but such a simple pattern exists only for the moment when the cumulus cloud is most developed (for less than 10 minutes). The flow associated with the development of cumulus changes continuously with time. During the developmental phase of a cumulus cloud, when convective instability is being resolved, the height of the cumulus increases, and its transport effect is not simple. For example, you can see inflow just below the outflow near the top of the developing cumulus at 20 min. After the maturing period, it is even more complicated. The chimney-like circulation is immediately lost, followed by patterns of vertically folded cells and then St. Andrew's Cross, which symbolize the generation of internal gravity waves.
This pattern changes rapidly and complexly with time, and represents an oscillating motion that repeatedly flows in and out of the cumulus. Note that the intensity of the flow, which can be judged from the spacing of the contours, does not vary significantly between convection and gravity waves, except for the cumulus updraft. In other words, there is no simple outflow throughout the life of the cumulus, but a very complex flow. This is due to the fact that the nature of the motion associated with a cumulus cloud is simply the transport and mixing only in the vertical direction. The time duration that each stage of the flow field is sustained is so short that horizontally transporting effect of each stage is very small. (For example, even if only the transport effects of the maturest stage remained, the maximum transport distance would only be 10 ms-1 x 600 s = 6000 m. Note that air parcels do not move far along streamlines!) That is, the net dynamical transport integrated over the lifetime of the cumulus cannot be large enough to carry the transport from the inside of the cumulus to the outside, as Dynamical Detrainment (DD) supporters claim.
[NOTE]
It is this internal gravity wave emission that demonstrates
the impossibility of steady convectively-driven circulation.
The convectively-forced flow tries to disturb the current equilibrium state
(which is maintained by the Radiatively-Driven Circulation)
and if it succeeded,
a convectively-driven circulation would be established
to change the equilibrium state to its own,
but it is repelled by the density stratification of the atmosphere
to be the internal gravity waves.
Convectively-driven circulation cannot become dominant in the atmosphere
unless the forcing due to cumulus convection is sustained steadily
and suppresses gravity wave emission.
The duration of the cumulus convection in the Earth's atmosphere
is too short and sparse.
[NOTE]
Another reason why convection-driven circulation is not closed is
the long time scale of radiative cooling in the Earth's atmosphere.
If radiative cooling outside the cumulus could act fast enough
to cancel the adiabatic heating of the forced-down air parcels
and completely remove their buoyancy,
convection-driven circulation would be possible.
In reality, however,
it takes much longer for the radiative cooling
to lower the temperature of the air parcel
than it does for the convective forcing
to adiabatically heat the air parcel.
So when the air parcel is forced down,
the adiabatic heating remains even though the radiative cooling is working.
This causes the air parcel to be forced down warmer than the surrounding atmosphere,
so buoyancy force is applied and the air parcel bounces back as a gravity wave.
[NOTE]
Although often referred to as "convectively-driven circulation"
because of the distribution of the streamfunction as seen at time 40 minutes,
there is actually no closed flow field that can be called "circulation"
due to convection in the troposphere
(except in the CBL).
Time averaged over this single convective event,
all that remains significant is
complex vertical mixing with small scales and its upward transport
confined to the interior of a few kilometer wide cumulus domain.
Outside the cumulus, the effect of the convective motion, which is short-lived,
is canceled out by the effects of the subsequent internal gravity waves.
[NOTE]
Without performing numerical experiments using computers,
when cumulus clouds develop in the real atmosphere,
people often see anvil clouds flowing out to the surroundings near their tops.
DD advocates say that this anvil is their master card,
which visualizes the blowing-out at the top of the cumulus.
Unfortunately, madam and sir, this card does not work here.
Some rudimentary knowledge of fluid motion shows that
anvil is not a blowing-out but rather should be taken as evidence of RDC
.
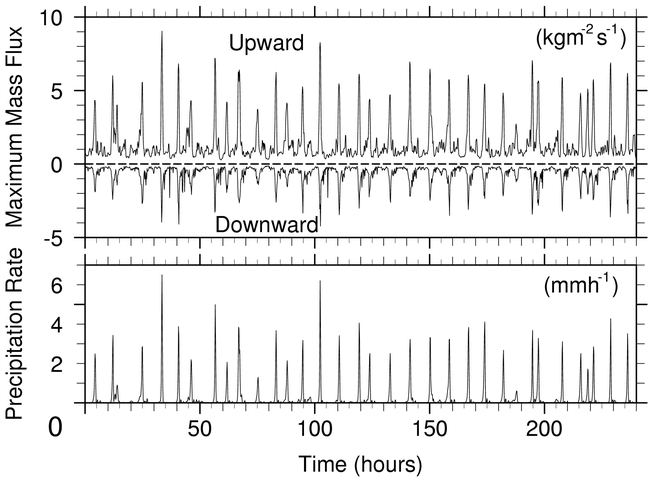
As a fatal addition, as shown in Fig. TTCA-2, the time intervals between cumulus events are about 10 hours, during which the convectively-driven circulation completely dissipates. In fact, after obtaining an equilibrium atmosphere with DCM, we spent more than half a year studying the transport associated with such convective circulation and were completely unable to extract any meaningful horizontal transport. The transport provided by cumulus convection is limited to the vertical direction only, mixing the air in the upper and lower layers of the atmosphere to resolve the convective instability.
[NOTE]
The maximum upward mass flux shown in Fig. TTCA-2 occurs over a width of one or two grids,
while the grids with the maximum downward mass flux are on either side of this updraft,
and the grids around it also have downdrafts.
This means that
the upward and downward mass fluxes,
which are dynamically forced by convection,
almost cancel each other out
in the immediate vicinity of the cumulus cloud.
Thus, convectively-driven circulation is inefficient in horizontal transport. Nevertheless, the convectively-driven circulation can be seen by human eyes as a cumulus cloud, and is intuitively easy to recognize due to its short time scale and familiar as a meteorological phenomenon. Because of this, it is easy to misunderstand that this convectively-driven circulation dominates the transport process in the atmosphere. This erroneous assumption has led to the idea of Dynamical Detrainment. Or rather, they had no other choice. Researchers have been devoting their efforts to studying this convectively-driven circulation, which is prominent but has no significance in horizontal transport.
The results shown here are obtained from a model with a resolution of 1 km horizontally and 250 m vertically. The real atmosphere has a much more finely structured flow field, and the cumulus updraft breaks up into much finer vortices. Therefore the real flow is not exactly as shown here. The essential points that can be understood from this model experiment are that the cumulus updraft, which is contained in the convective circulation, has a local mixing effect by breaking up into fine turbulent vortices, and that the updraft can only eject gravity waves and cannot create a closed forced circulation by pushing down the atmosphere outside of the cumulus.
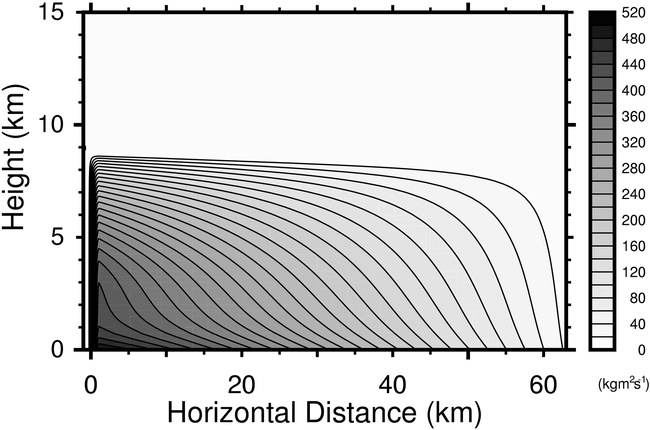
Meteorology, or weather forecasting, is interested in precipitation and strong winds generated by the convectively-driven circulation (CDC). Therefore, CDC has been studied in detail as a central topic in atmospheric science. It seems that they have already succeeded in developing the so-called cumulus dynamics, which allows correct prediction of precipitation and winds, not only for isolated cumulus clouds at low latitudes, but also for structured cumulus clouds at mid and high latitudes. Since most researchers involved in climate research have a background in meteorology, it is natural that they have applied the cumulus dynamics to the internal-to-external transport phenomena of cumulus clouds that are important for climate prediction. However, the dynamical detrainment (DD) method based on cumulus dynamics has been completely unsuccessful so far. They say that this is attributed to the immaturity of the parameter tuning due to the lack of theory and observations for the CDC. However, this view is fundamentally wrong, because the net transport around the cumulus cloud is not due to the CDC. We have found a completely different kind of circulation in the DCM atmosphere, which has much larger temporal and spatial scales than the CDC, and which is responsible for climatologically substantial transport processes. That is the Radiatively-Driven Circulation (RDC), described next.
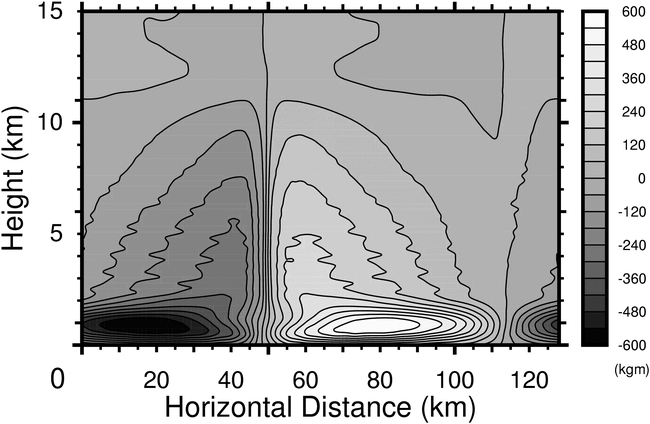
Unlike the dynamical flow field of CDC, which varies from moment to moment, the net flow field around a cumulus cloud can be obtained by taking a time average. Figure TTCA-3 shows the time-averaged atmospheric streamfunction. Outflow from the cumulus occurs at all altitudes between the top of the convective boundary layer (CBL) and the top of the cumulus. This feature differs significantly from that of convectively-driven circulation, in which outflow occurs only near the top of the cumulus cloud, shown at 40 min. in Fig. TTCA-1. Detrainment at low altitudes, as shown in Figure TTCA-3, moistens the entire atmosphere. This is because the water vapor in the air within the cumulus cloud is transported at lower altitudes directly to the surrounding clear area, before it condenses and is removed as precipitation as the air rises to higher altitudes within the cumulus cloud.
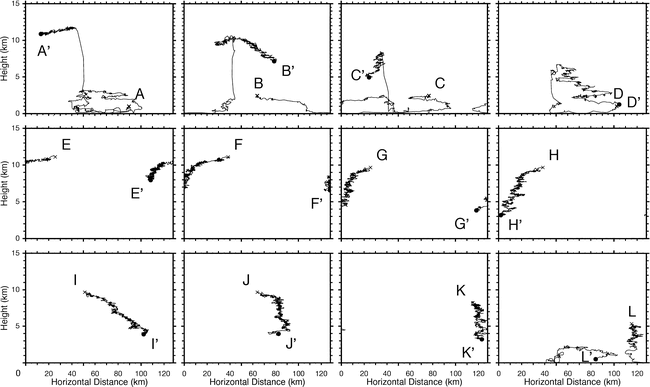
We tracked the flow by scattering a large number of tracers with no inertia in the model atmosphere. Each curve in Fig. TTCA-4 shows the path of the respective tracer and thus the actual trajectory along which the air parcel was transported. The paths of the tracers corresponds to the time-averaged flow field obtained in Fig. TTCA-3. The movement of the tracers was not significantly affected by the development of the cumulus, except in the case where the tracers happened to be captured by a strong updrafts in the cumulus and lifted rapidly. In general, tracers subside at a slow and almost constant rate in the atmosphere while oscillating finely. The oscillations are considered to indicate disturbances caused by internal gravity waves emitted when the cumulus convection is broken and from the convective motion in the CBL. This net circulation can only be obtained over a long time scale, making it very difficult for the human to intuitively understand.
We showed that this net flow field is Radiatively-Driven Circulation (RDC), composed of a subsidence flow field consistent with the radiative cooling and a horizontal flow field that compensates for the mass divergence ( Iwasa et al. 2002). Figure TTCA-5 shows an example of the streamfunction obtained from KCM (Kinematic Circulation Model), which assumes only RDC and excludes dynamical transports outside the cumulus. The flow patterns in Figs. TTCA-3, TTCA-4, and TTCA-5 correspond with each other. In other words, the net flow field around the cumulus cloud is a "Radiatively-Driven Circulation" based on radiative cooling and atmospheric continuity in a thermally equilibrium atmosphere.
Please note that the streamlines in Fig. TTCA-5 obtained from KCM are very smooth.
On the other hand,
the streamlines in Fig. TTCA-3 and paths in Fig. TTCA-4 obtained from DCM
show fine perturbations.
These perturbations do not indicate a problem with the numerical scheme of DCM,
but represent short time scale perturbations caused by internal gravity waves
generated in DCM.
(It is worth mentioning here that DCM and KCM use
exactly the same numerical scheme for advection.)
Since KCM has eliminated the dynamics,
the flow field does not contain internal gravity waves,
resulting in a smooth distribution.
In the troposphere above the CBL,
the only difference between the time-averaged flow fields of DCM and KCM
is the small-scale perturbations.
Assuming that this is due to the difference between DCM and KCM,
i.e. the presence or absence of dynamics,
we can conclude that outside the cumulus it is the RDC that determines the net circulation,
and that the only function of the dynamics is to cause these small perturbations.
That is,
even if the implementation of the DD method based on dynamics
were perfectly successful and expressed the correct effects,
it could only create these small perturbations.
This is precisely the reason why, despite half a century of attempts,
the DD method has not worked.
And thus, we can say with certainty that the DD method has no future.
[NOTE]
This discussion is limited to the outward transport of cumulus clouds.
The other and most important effect of dynamics is, of course,
the buoyancy-based vertical mixing within the cumulus,
which transports mass/heat/water vapor upward,
thus eliminating convective instability in the atmosphere.
In summary, the convectively-driven circulation with a short time scale, which is created by the resolution of convective instability, and the Radiatively-Driven Circulation with a long time scale, which is created to maintain thermal equilibrium and mass continuity in the atmosphere, are two completely different circulations. The trouble is that net transport is provided not by the intuitive convectively-driven circulation, but by the less intuitive Radiatively-Driven Circulation (RDC). Don't be fooled by the Dynamical Detrainment based on the convectively-driven circulation, and consider RDC immediately!
[NOTE]
KCM is a model in which only RDC is implemented.
The CBL is essentially a region dominated by convective processes
and is therefore not represented in KCM.
We have applied a simple boundary condition at the lower edge of the atmosphere,
passing through the ground surface.
[NOTE]
Some of you may still suspect that RDC relies on our own models,
DCM extracting RDC and KCM confirming the transport capacity of RDC.
Our
another RDC application
to the atmosphere
obtained from a completely different cloud-resolving atmospheric model,
explaining the melting-level detrainment flow,
should dispel such doubts.
[NOTE]
Others may be concerned that the RDC mechanism could work
only in a two-dimensional atmosphere.
However,
the fundamental physical processes assumed by RDC are only
radiative cooling,
balancing subsidence flow,
and horizontal flow that compensates for the mass divergence,
outside of the cumulus cloud.
These processes are valid in both 2D and 3D atmospheres.
Therefore, it is not reasonable to think that RDC does not occur in a 3D atmosphere.
Our new RDC Cumulus Parameterization
is an attempt to apply the RDC mechanism
extracted from the 2D mean atmosphere to the 3D real-time atmosphere.
Please take a look.
[NOTE]
Guess what results these features of the two circulations might lead to.
It is not so difficult to extract Radiatively-Driven Circulation,
because it is physically simple.
Even if we didn't do it, someone, someday, must have found it.
However, it is hopelessly difficult to convince the most people,
for whom the "validity" of convectively-driven circulation is ingrained in their senses,
both visually and through everyday experience,
that it is false.
(In fact, 20 years after we published the RDC papers,
no successor has emerged!)
If we were told that the Earth is floating in space
and revolving around the Sun at high speed,
modern people would take it for granted.
But that is because we have been educated that way.
You know what would happen to medieval people
who did not know about spaceships or GPS if you told them the same thing.
The best way to wake up from brainwashing of common sense is to imagine.
Because in the world that imagination takes us to,
we can experience physical phenomena intuitively.
But even for the most people who can't imagine,
there is the next best way: think logically.
It may be unacceptable in our daily experience,
but the logically consistent result should be accepted as possibly correct.
Conversely,
you must accept that arguments containing logical flaws are scientifically fallacious.
If you find even the slightest
inconsistencies with the convectively-driven circulation and with DD
,
think about it thoroughly.
You will see that the convectively-driven circulation was your preconceived notion.
We hope that as many researchers as possible will wake up
from the never-ending DD nightmare.
Two Types of Circulation in the Atmosphere < rdctheory.cloud
Exhibited on 2023/04/03
Last updated on 2024/12/25
Copyright(C)2022-2024 jos <jos@kaleidoscheme.com> All rights reserved.